|
|
|

|
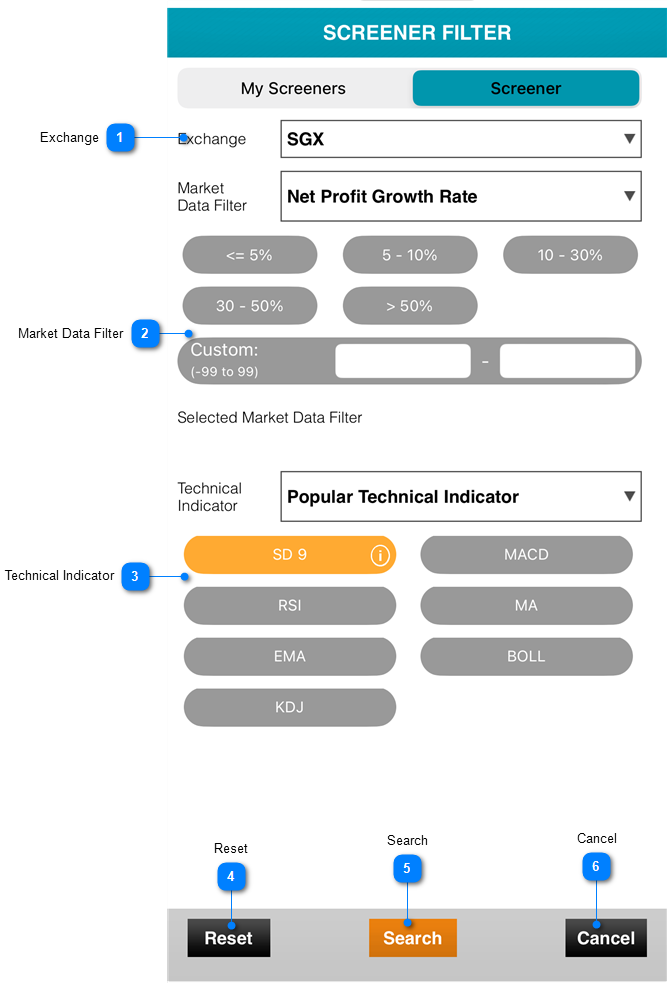
Exchange
|
|
Select either a single market or multiple markets for screening.
.png)
|
|

|
Market Data Filter
|
|
The "Market Data Filter" is a tool used to refine and narrow down the data related to financial markets based on specific criteria or preferences.
.png)
|
-number-10.png)
|
Data Filter Options
|
|
Provide the different filter criteria such as Previous Close, Previous Volume, Market Value, PE Ratio (TTM), Dividend Yield, Revenue, Revenue Growth Rate and Net Profit Growth Rate. Market Data Filter is limited to 3 criteria.
.png)
|
-number-11.png)
|
Previous Close
|
|
The "Previous Close" filter criteria categorizes assets based on their previous close price into several predefined ranges, as well as a custom range. Here's how you can express these filter criteria:
"Previous Close Price <= 1";
"Previous Close Price between 1 and 5";
"Previous Close Price between 5 and 10";
"Previous Close Price between 10 and 50";
"Previous Close Price >= 50";
"Custom Range: Previous Close Price between 0 and 9,999";
These criteria allow you to categorize assets based on their previous day's closing prices, making it easier to identify assets that fall into specific price ranges or meet custom conditions for analysis or investment strategy.
|
.png)
|
-number-12.png)
|
Previous Volume
|
|
The filter criteria for "Previous Volume" that categorize assets based on their trading volume:
"Previous Volume <= 100,000 shares";
"Previous Volume between 100,000 and 500,000 shares";
"Previous Volume between 500,000 and 1 million shares";
"Previous Volume between 1 million and 10 million shares";
"Previous Volume >= 10 million shares";
"Custom Range: Previous Volume between 0 and 999,999,999 shares";
These criteria allow you to classify assets based on their previous day's trading volumes, helping you identify assets with specific trading activity levels or meet custom volume conditions for analysis or investment strategy.
|
.png)
|
-number-13.png)
|
Market Value
|
|
The filter criteria for "Market Value" that categorize assets based on their market capitalization:
"Market Value <= $1 billion";
"Market Value between $1 billion and $10 billion";
"Market Value between $10 billion and $200 billion";
"Market Value >= $200 billion";
"Custom Range: Market Value between $0 and $999,999,999,999";
These criteria allow you to categorize assets based on their market capitalization, making it easier to identify assets with specific market value ranges or meet custom market value conditions for analysis or investment strategy.
|
.png)
|
-number-14.png)
|
PE Ratio (TTM)
|
|
The filter criteria for "PE Ratios (TTM)" that categorize assets based on their price-to-earnings ratios:
"PE Ratios (TTM) between 0 and 10";
"PE Ratios (TTM) between 10 and 25";
"PE Ratios (TTM) between 25 and 50";
"PE Ratios (TTM) >= 50";
"Custom Range: PE Ratios (TTM) between 0 and 99";
These criteria allow you to classify assets based on their price-to-earnings ratios, helping you identify assets with specific PE ratio ranges or meet custom PE ratio conditions for analysis or investment strategy.
|
.png)
|
-number-15.png)
|
Dividend Yield
|
|
The filter criteria for "Dividend Yield" that categorize assets based on their dividend yields:
"Dividend Yield between 0 and 1%";
"Dividend Yield between 1% and 3%";
"Dividend Yield between 3% and 5%";
"Custom Range: Dividend Yield between 0 and 99%";
These criteria allow you to classify assets based on their dividend yields, helping you identify assets with specific dividend yield ranges or meet custom dividend yield conditions for analysis or investment strategy.
|
.png)
|
-number-16.png)
|
Revenue
|
|
The filter criteria for "Revenue" that categorize assets based on their revenue:
"Revenue <= $50 million";
"Revenue between $50 million and $100 million";
"Revenue between $100 million and $1 billion";
"Revenue >= $1 billion";
"Custom Range: Revenue between $0 and $999,999,999,999";
These criteria allow you to classify assets based on their revenue figures, making it easier to identify assets with specific revenue ranges or meet custom revenue conditions for analysis or investment strategy.
|
.png)
|
-number-17.png)
|
Revenue Growth Rate
|
|
The filter criteria for "Revenue Growth Rate " that categorize assets based on their revenue growth rates:
"Revenue Growth Rate <= 5";
"Revenue Growth Rate between 5 and 10";
"Revenue Growth Rate between 10 and 30";
"Revenue Growth Rate between 30 and 50";
"Revenue Growth Rate >= 50";
"Custom Range: Revenue Growth Rate between -99 and 99";
These criteria allow you to classify assets based on their revenue growth rates, making it easier to identify assets with specific growth rate ranges or meet custom growth rate conditions for analysis or investment strategy.
|
.png)
|
-number-18.png)
|
Net Profit Growth Rate
|
|
The filter criteria for "Net Profit Growth Rate" that categorize assets based on their net profit growth rates:
"Growth Rate of Net Profit<= 5";
"Growth Rate of Net Profit between 5 and 10";
"Growth Rate of Net Profit between 10 and 30";
"Growth Rate of Net Profit between 30 and 50";
"Growth Rate of Net Profit >= 50";
"Custom Range: Net Profit Growth Rate between -99 and 99";
These criteria allow you to classify assets based on their net profit growth rates, making it easier to identify assets with specific growth rate ranges or meet custom growth rate conditions for analysis or investment strategy.
|
|
|
|

|
Technical Indicator
|
|
"Technical Indicator" provides filtering capabilities for various indicators such as Sequential Divergence 9, MACD, RSI, MA (Moving Average), EMA (Exponential Moving Average), Bollinger Bands (Boll), and KDJ. These indicators can be used to filter and refine results in the context of technical analysis for trading or investment purposes.
.png)
|
|

|
Reset
|
|
Reset function means reverting all previously selected scenarios back to their original default settings.
|
|

|
Search
|
|
Performing a search with the settings confirmed as per the selections made above.
|
|

|
Cancel
|
|
All selected settings and scenarios have been canceled.
|
|
|