
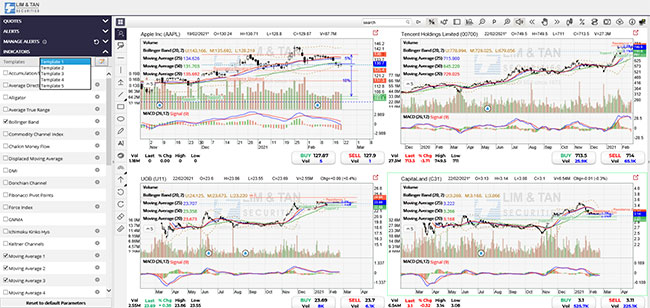
Internet Share Trading Live Charts
With the charting feature, you can view tick-by-tick data together with 10 years of historical data graphically. Apply your favourite technical indicators or draw your own price channels, support and resistance levels. You can create your own customised alerts and enjoy the flexibility to set conditions for each type of alerts.
- Accessible via Internet
- Compare up to 4 charts at one go
- Zoom to view long-to-short-term periods
- Text box feature to comment on your charts
- Various highlighting colours to differentiate price regions
- Use any technical analysis you like - moving averages, oscillators, fibonaccis, comparison charts, trendiness and more
- Compare to indices and draw trend lines
- Use performance Charts to compare one counter against another
- Displays the Sector Information, Industry, Market Cap, and Shares Outstanding of a stock
User Guide

Please click on the information icon for the User Guide. For more information, please contact your Trading Representative.
This advertisement has not been reviewed by the Monetary Authority of Singapore.