
Internet Share Trading Live Charts
(A) Live Charts Widgets
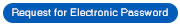
- Access more Widgets/Panels aside from the addition of 7 new widgets (Historical Top Movers, Quotes, Fear and Greed, Stock Idea, Live Alerts, Stock Listings & Earnings Calendar)
- Users can now customize the panel size to suit their preferences. Up to four panels can be displayed at once, allowing more information to be shown.
Access widgets via the button.
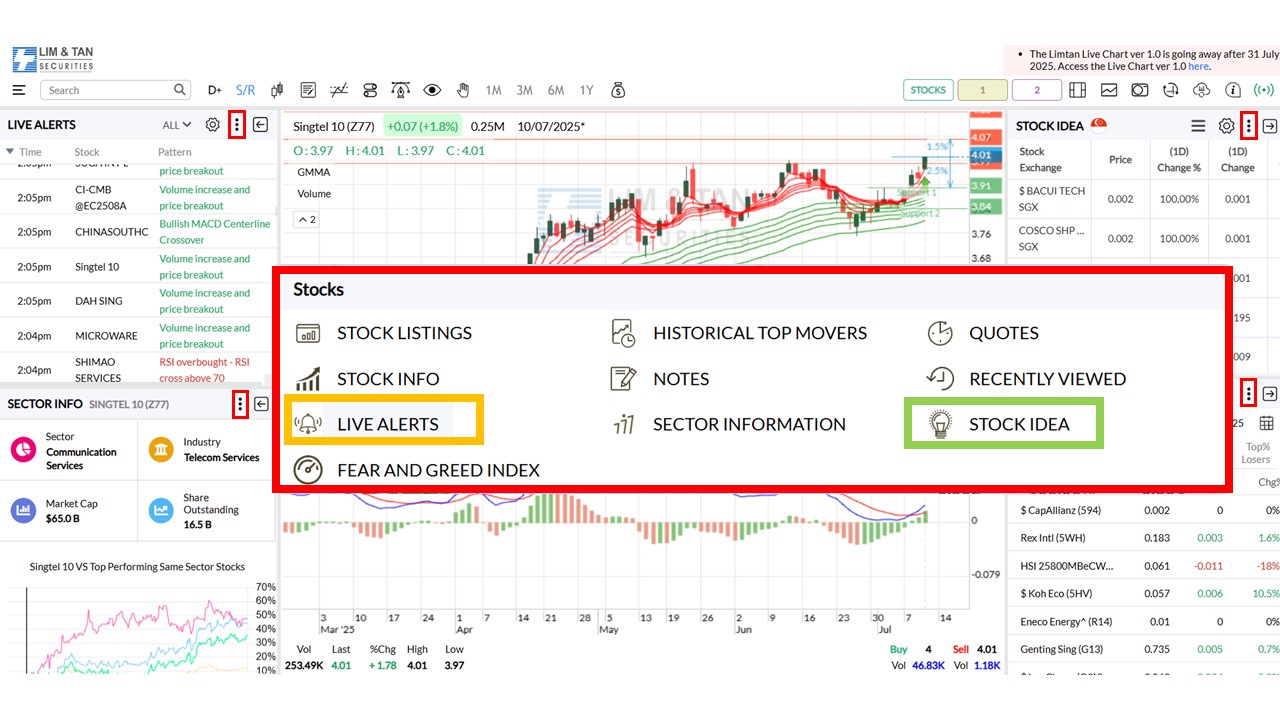
 - Live Alerts Widget: Showcases a list of bullish & bearish signals that can be enabled or disabled with additional 4 filters (Volume Average, ADR%, Relative Strength & Momentum%P) and Relative Volume Rule accessible via the
 icon.
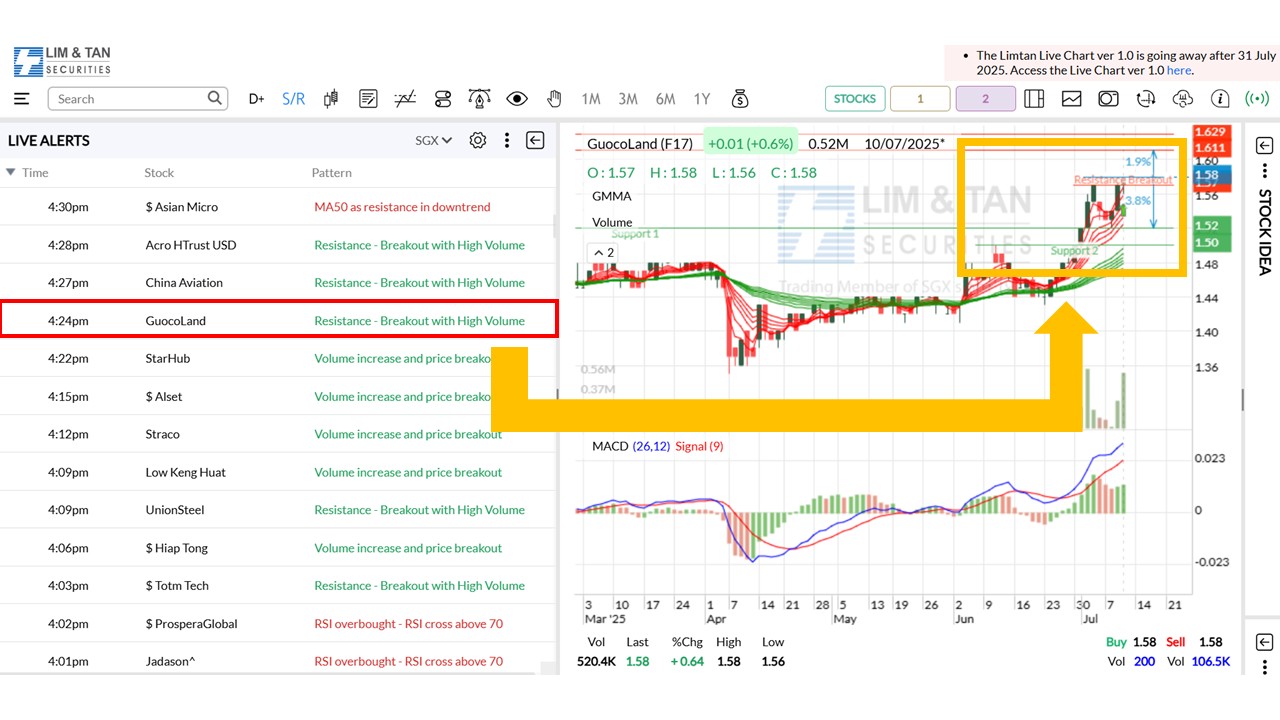
icon. - Stock Idea Widget: Customisable view based on template, column setup, period & stock categories. Screener filters can be edited based on personal preference.
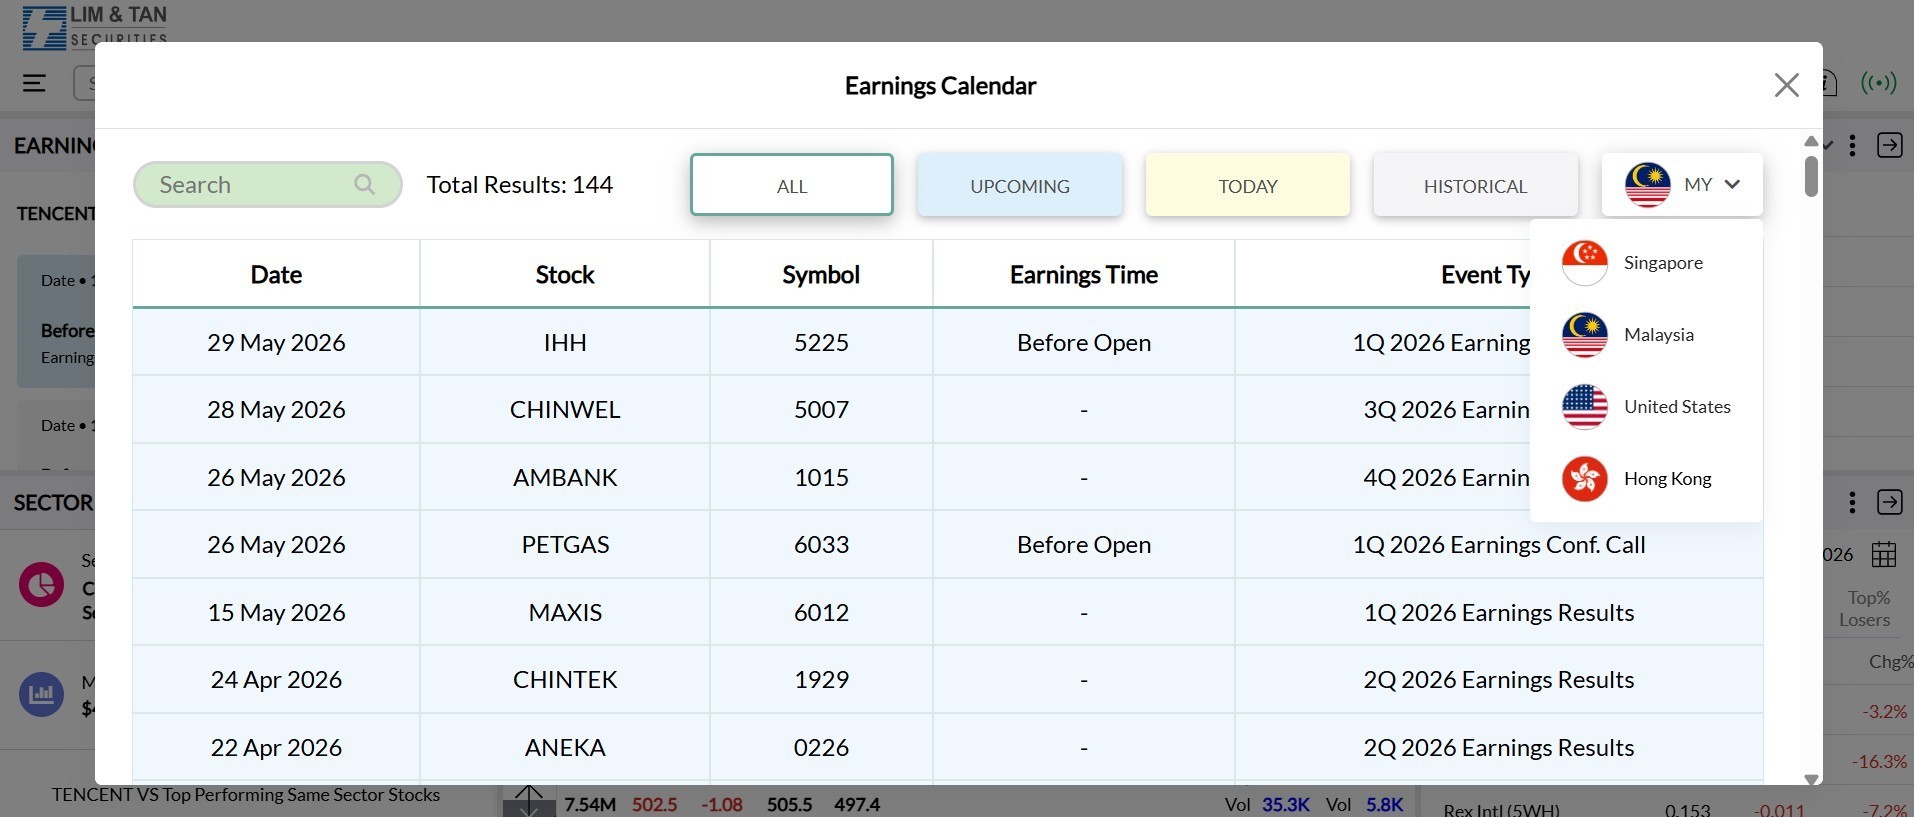
- Earnings Calendar Widget: Stay ahead of important market events by tracking earnings announcements with greater ease.
- Stock Name & Symbol: Identify each company by its stock name and symbol.
- Earnings Time: Timing when earnings are scheduled before market open or after market close.
- Event Type: Either earnings results or a conference call.
- All: View a comprehensive list of all upcoming earnings schedule.
- Upcoming: Focus on upcoming earnings announcements.
- Today: Today's earnings announcements.
- Historical: Review past earnings data to analyse trends and outcomes from previous announcements. The historical data is available for up to 10 years.
Earnings Calendar
Categories To Explore
Detail features of the Earnings Calendar:
The Earnings Calendar feature will be accessible via the ![]() button or the
button or the ![]() icon through three key components:
icon through three key components:
1. Main Popup
All earnings events are aggregated by counters in the selected markets, namely Singapore, United States, Hong Kong or Malaysia. This includes a search function to look up earnings details under ALL, UPCOMING, TODAY or HISTORICAL.
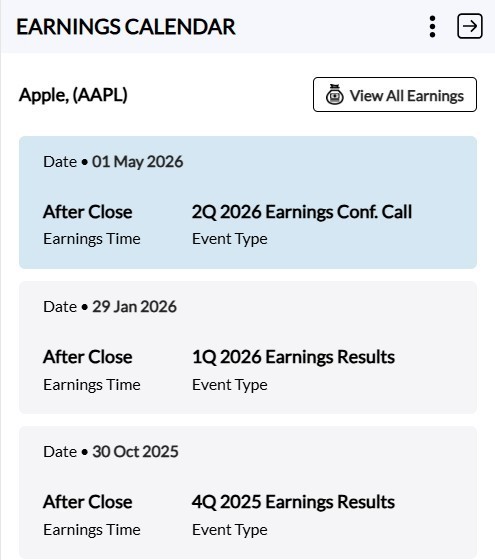
2. Side Panel
Displays earnings events for the selected counter.
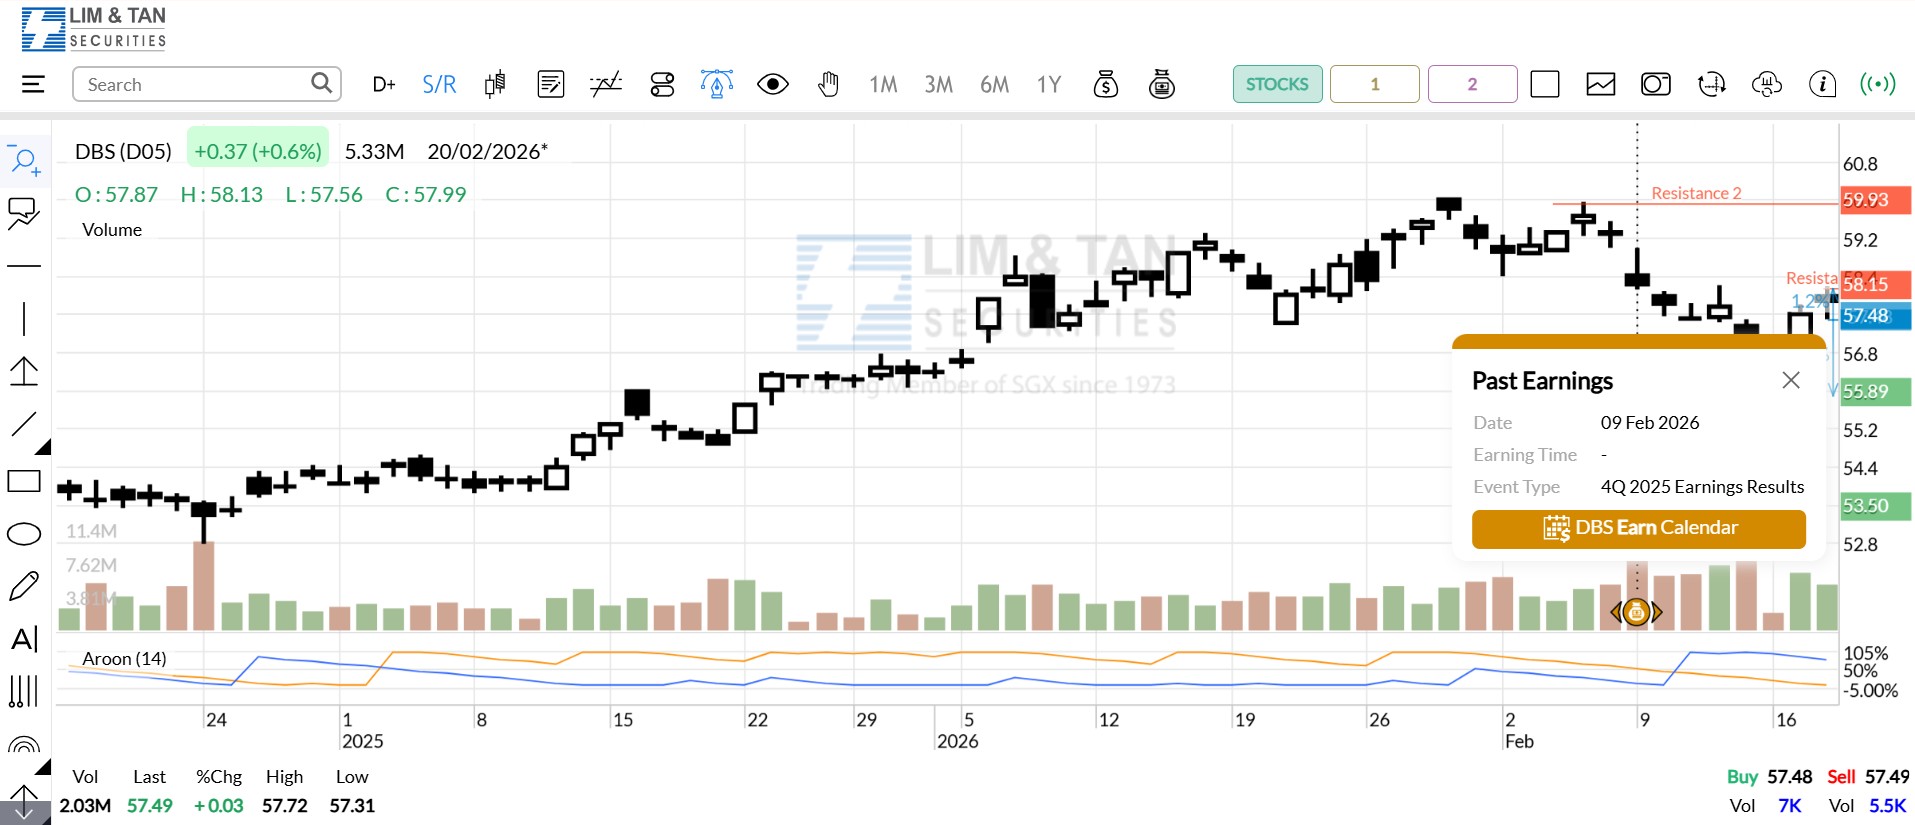
3. Icon & Small Popup
Click the ![]() icon to display a popup showing detailed earnings event information for the selected counter on the selected date.
icon to display a popup showing detailed earnings event information for the selected counter on the selected date.
- Chart Layout/Panel Layout
Users now have more viewing options, with 15 layout types to choose from and up to four panels to view.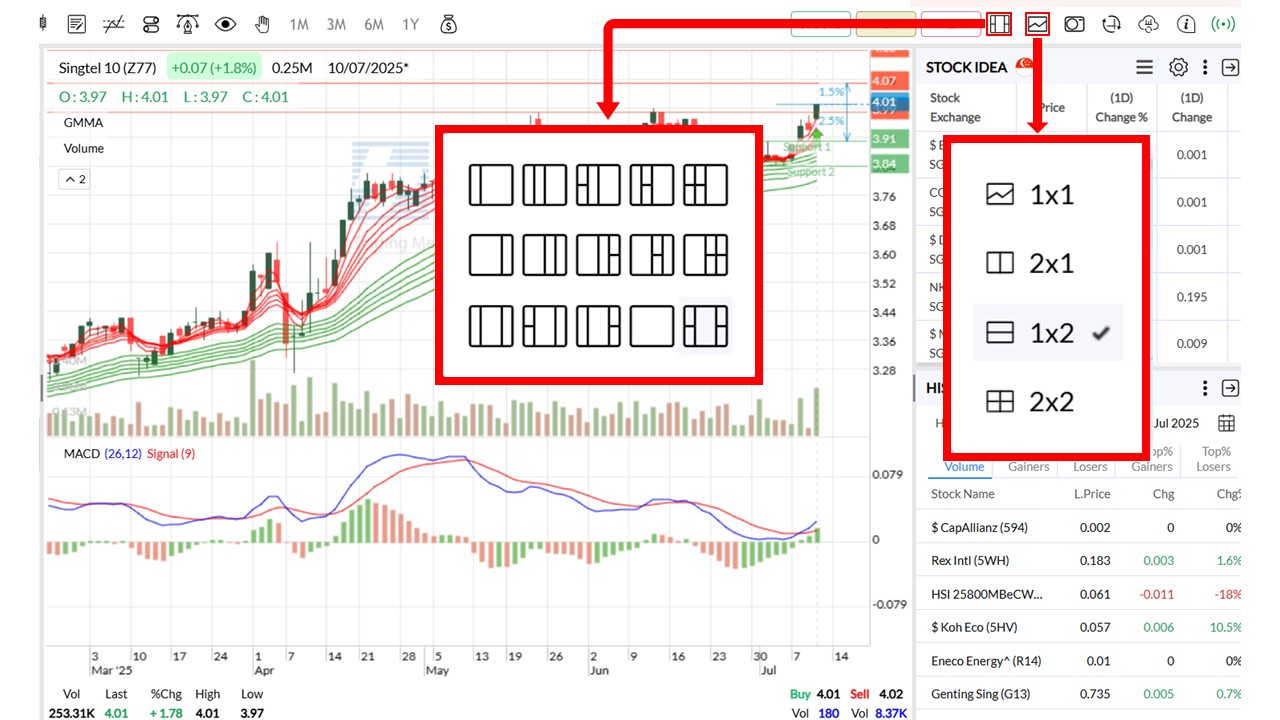
User Guide

Please click on the ![]() icon or here for the User Guide. For more information, please contact your Trading Representative.
icon or here for the User Guide. For more information, please contact your Trading Representative.
This advertisement has not been reviewed by the Monetary Authority of Singapore.