
Lim & Tan Securities (LTS) AI Charting FAQ
-
01. WHO IS ELIGIBLE TO USE LTS AI CHARTING?
LTS AI Charting is available to all Online Trading clients.
-
02. DO I NEED TO PAY TO USE LTS AI CHARTING?
No, LTS AI Charting is offered complimentary to all Lim & Tan Online Trading Accounts.
-
03. WHAT ARE THE MARKETS AVAILABLE FOR LTS AI CHARTING?
SGX, Bursa, HKSE, NYSE and Nasdaq. -
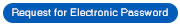
04. HOW DO I ACCESS THE LTS AI CHARTING VIA THE WEB?
After logging in to our web-based platform, select "Mkt Prices" followed by "AI Screener".
Do a right click on the counter you would like to access from your watchlist and choose "AI Chart".
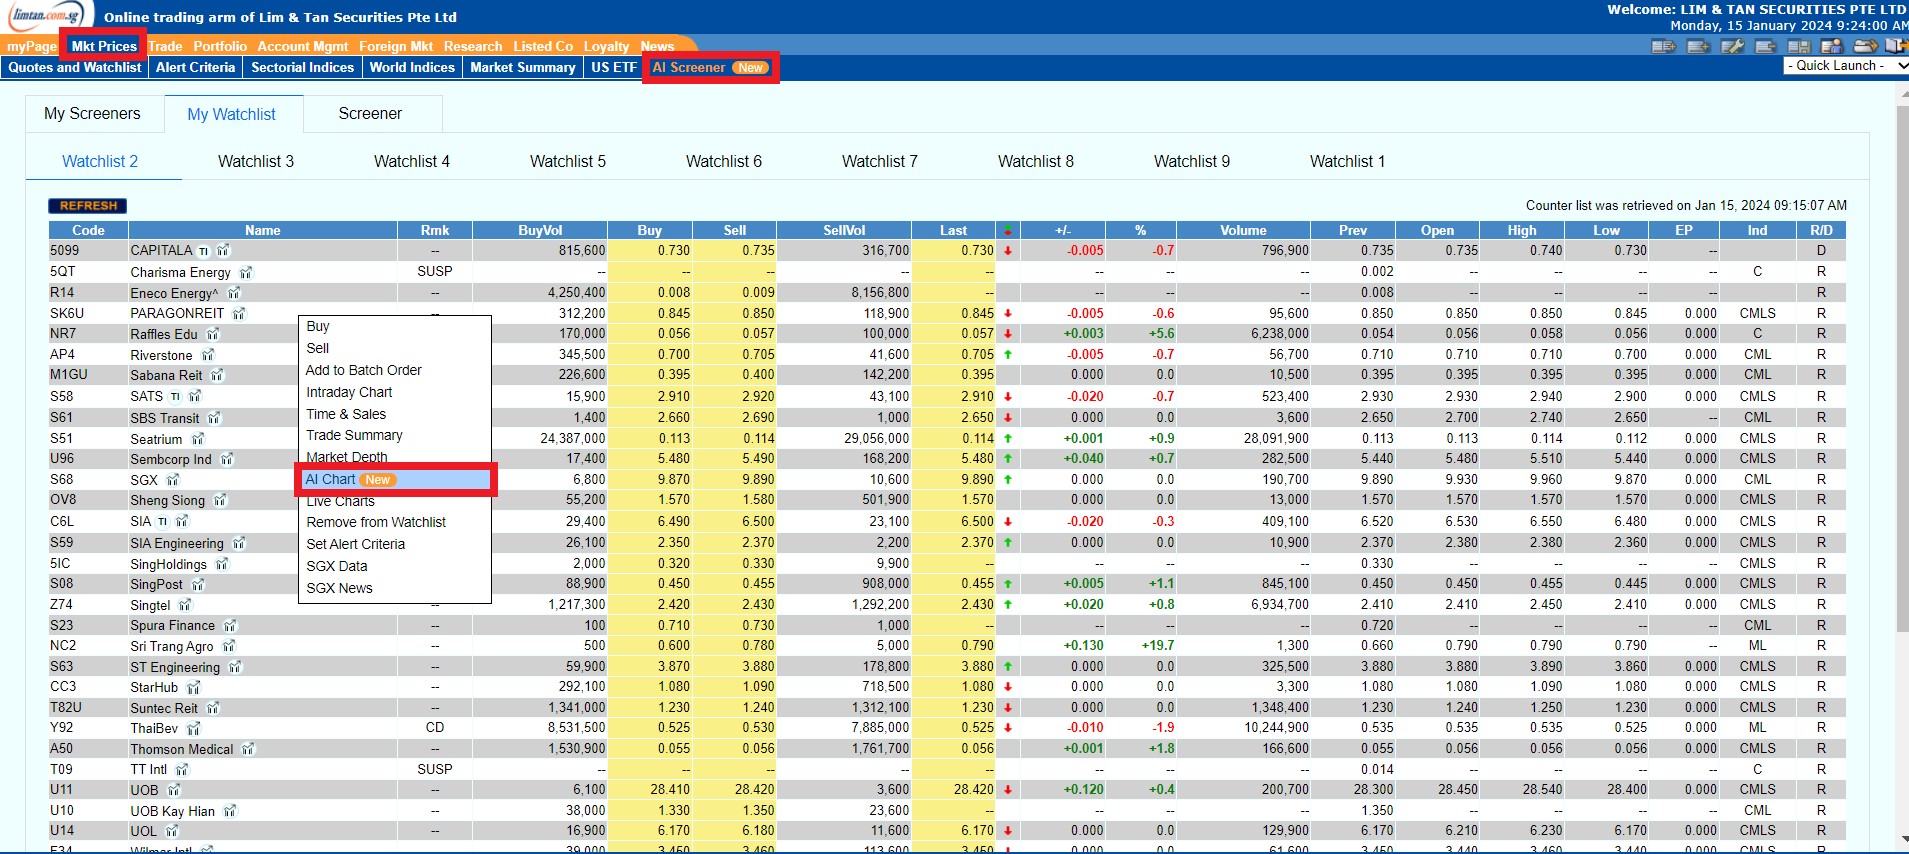
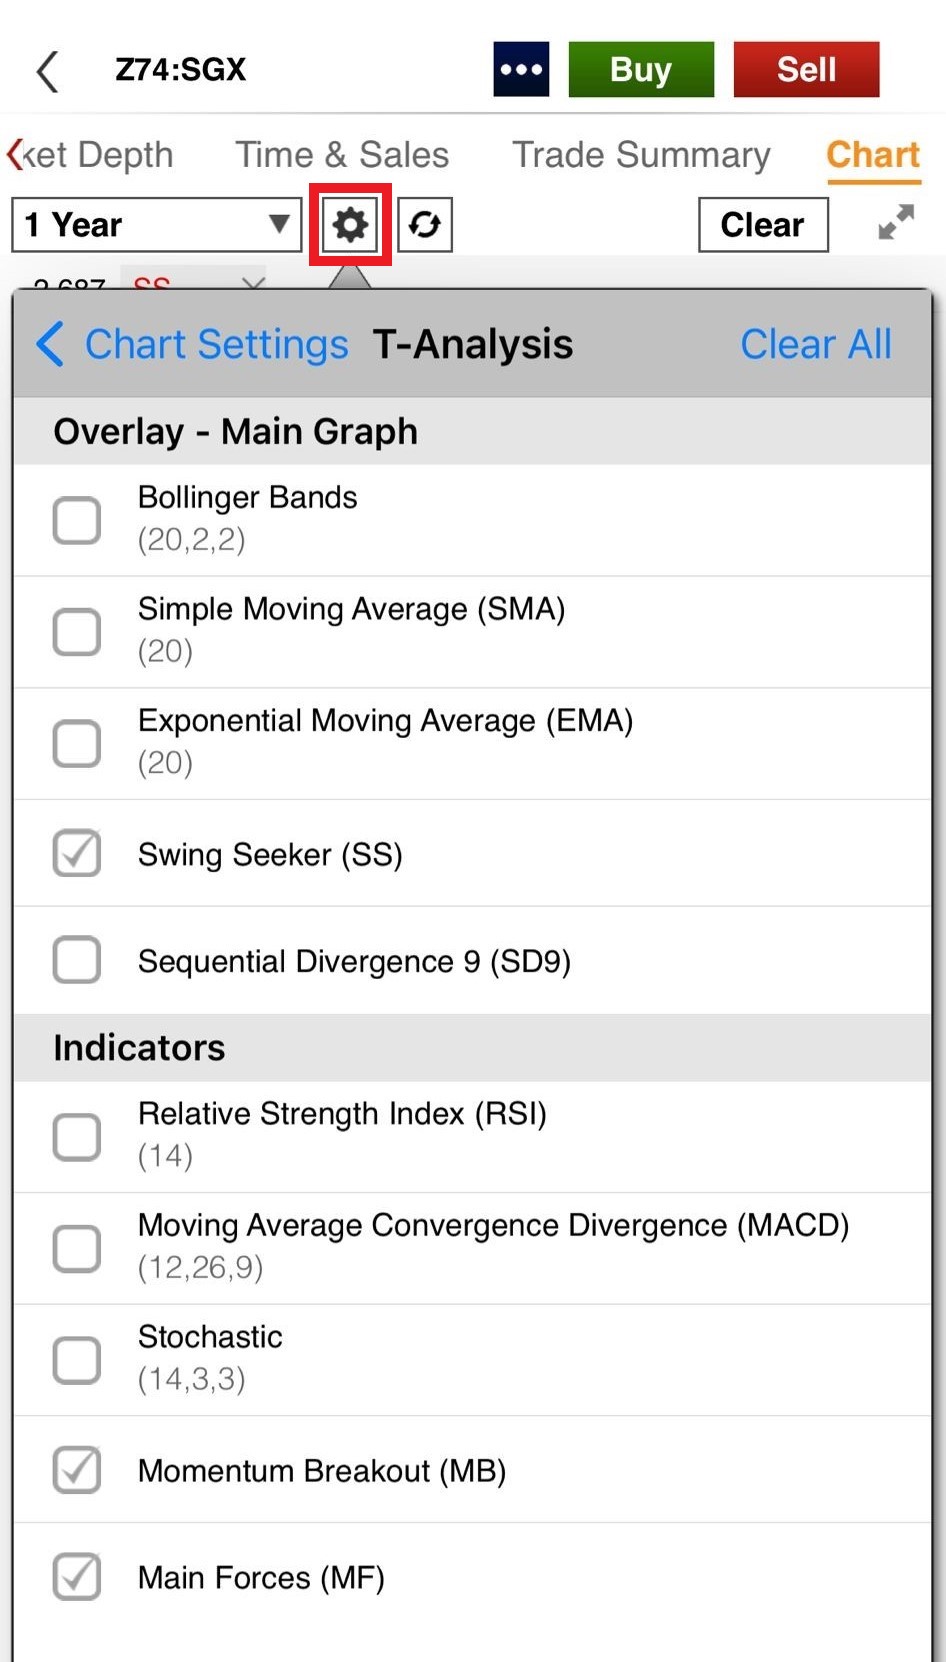
To view the unique indicators on the Web AI Chart, go to "Indicators".
For the mobile version, please refer to the following User Guide.
-
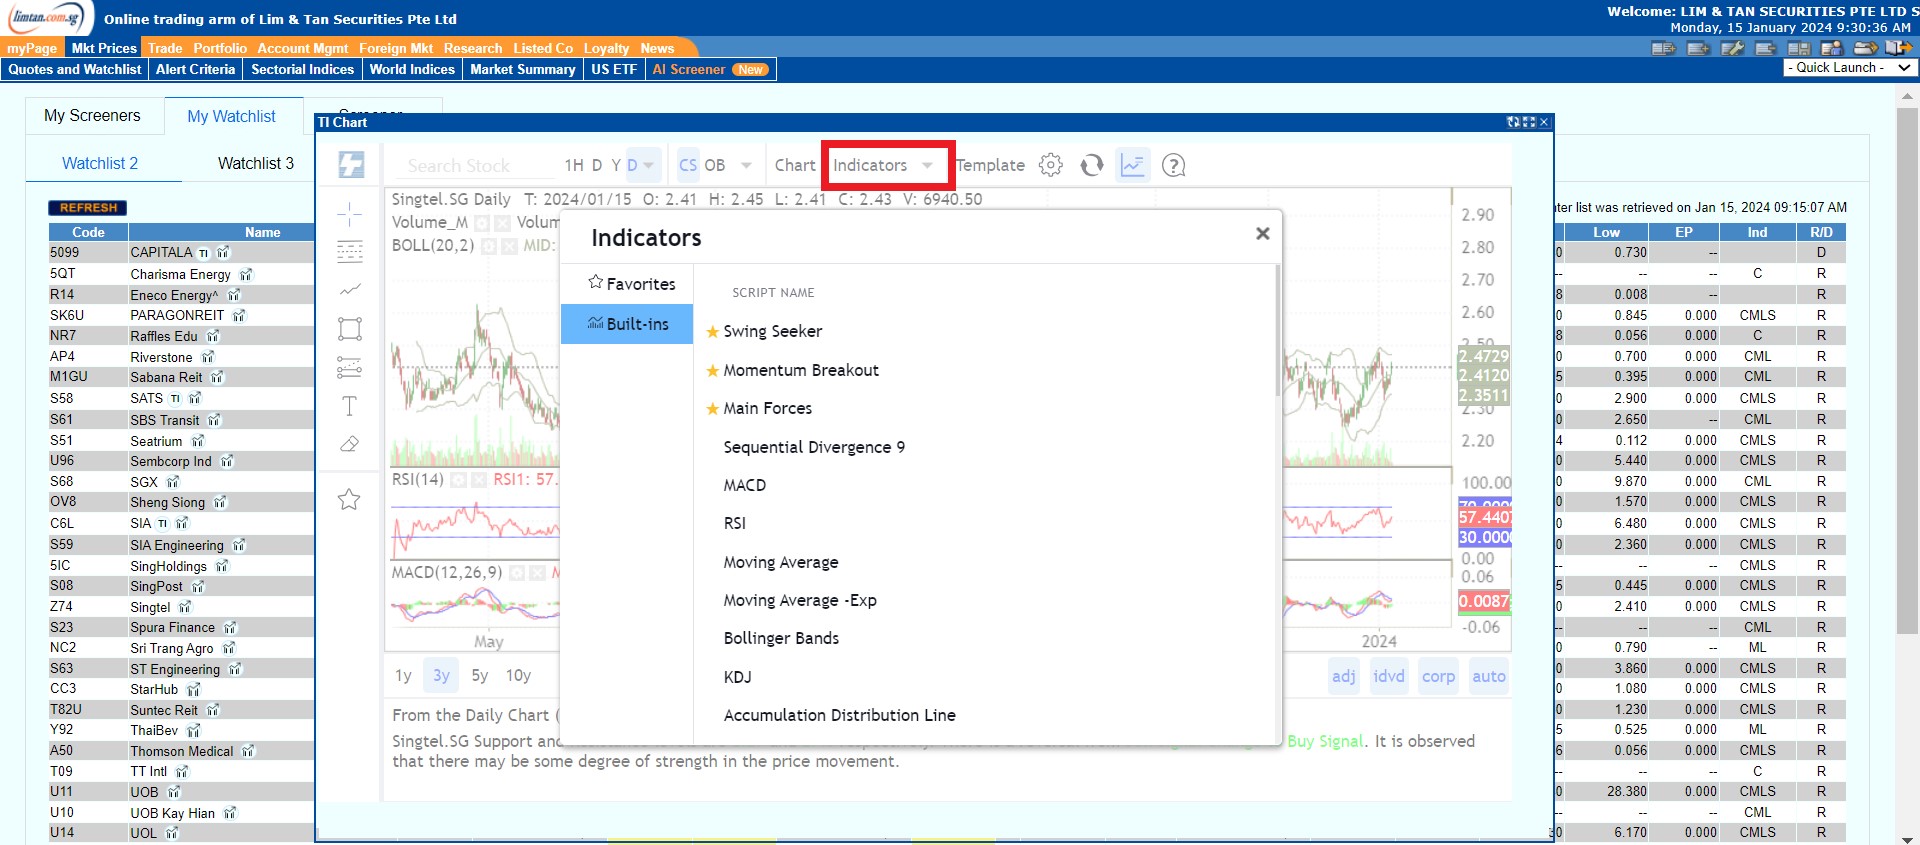
05. HOW DO I PLACE AN ORDER?
LTS AI Charts allows you to place order directly from the chart. After accessing the LTS AI Charting, do a right click at the specific point in the chart and a menu will pop up for you to place your order at the price at the specific point in the chart.
-
06. WHERE CAN I VIEW MY PLACED ORDERS?
Placed order will be visible on the AI Chart itself. This is in addition to being able to view the orders in the Order Book. Please remember to check that the order has been correctly placed with the correct order status after submitting the order.
-
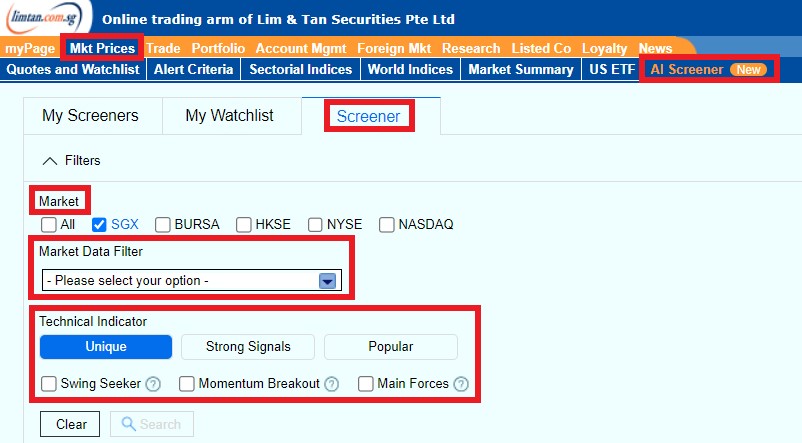
07. WHAT ARE THE UNIQUE INDICATORS FOR LTS AI CHARTING?
On our web-based platform, you may view the "Swing Seeker", "Momentum Breakout" and "Main Forces" indicators after selecting "Mkt Prices", "AI Screener", followed by "Screener". Choose a "Market" and select a "Market Data Filter". Click on "Unique" under "Technical Indicator". To learn more about these unique indicators, you may select the "?" button on the right side of each indicator.
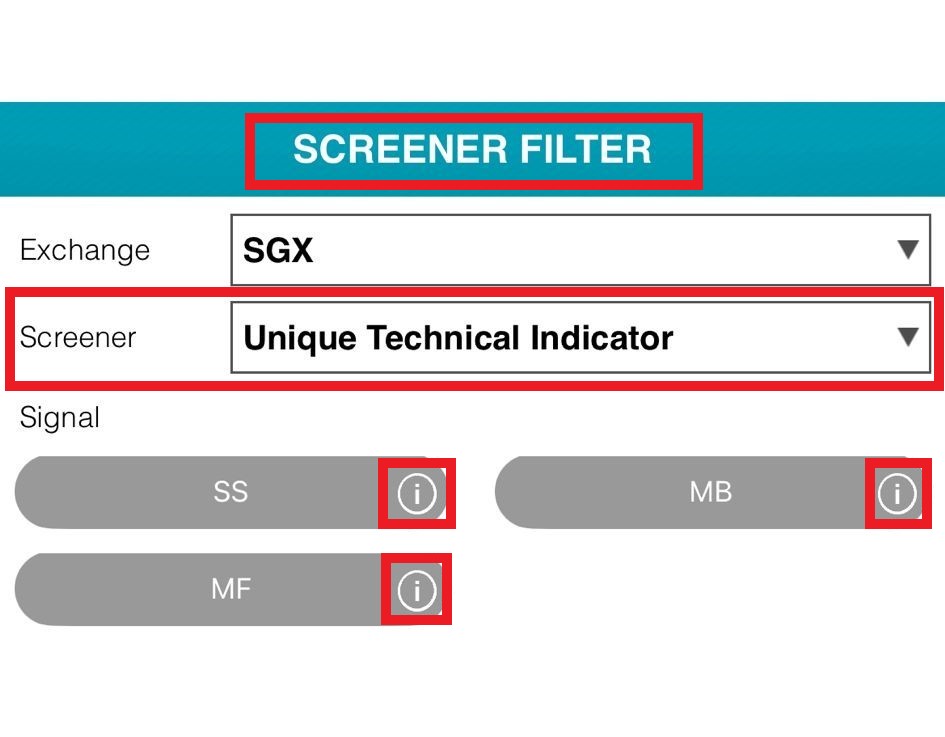
On our mobile app, click on the
 icon and select "Screener". Under "SCREENER FILTER", choose "Unique Technical Indicator" to view the "Swing Seeker", "Momentum Breakout" and "Main Forces" indicators. To learn more about these unique indicators, you may select the "i" button on the right side of each indicator.
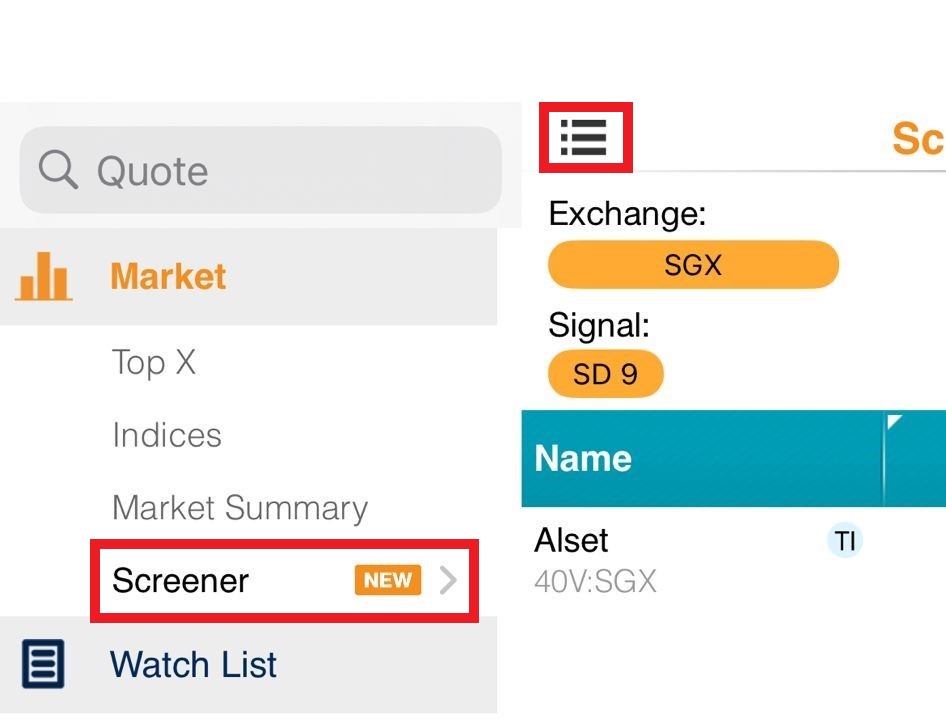
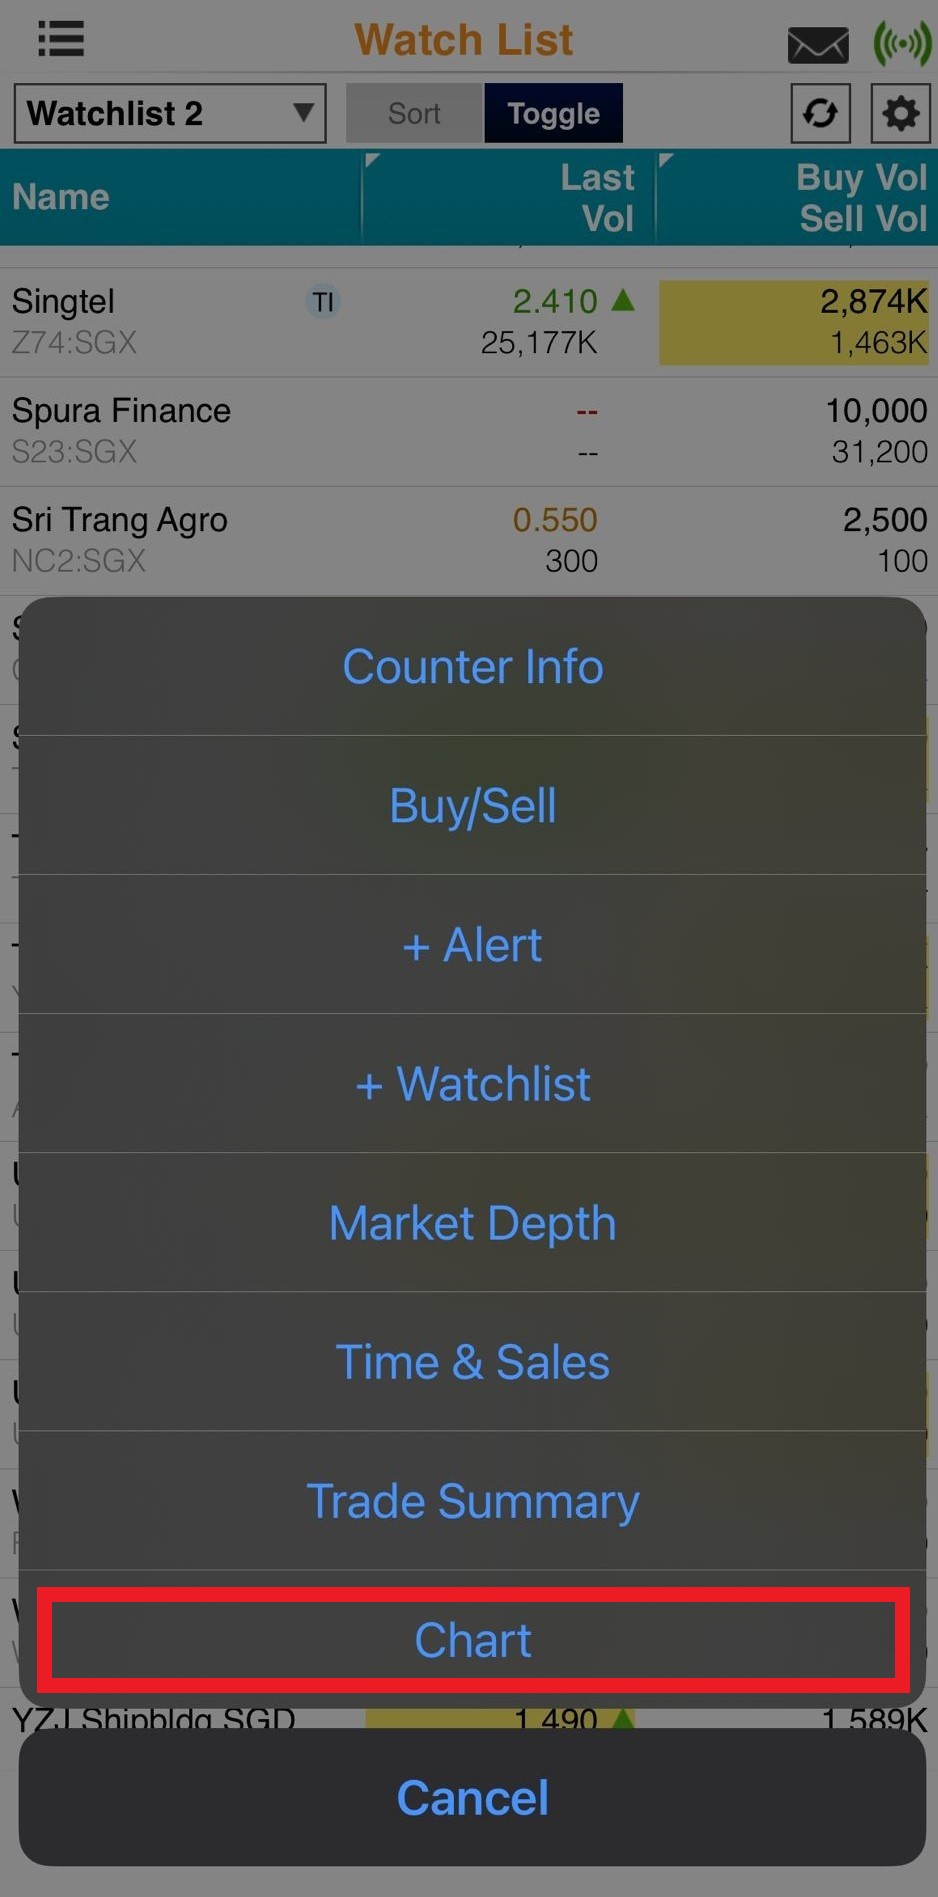
To view the unique indicators on the Mobile AI Chart, go to your watchlist and click on the counter you would like to access. Select "Chart" and the
 icon.
icon. 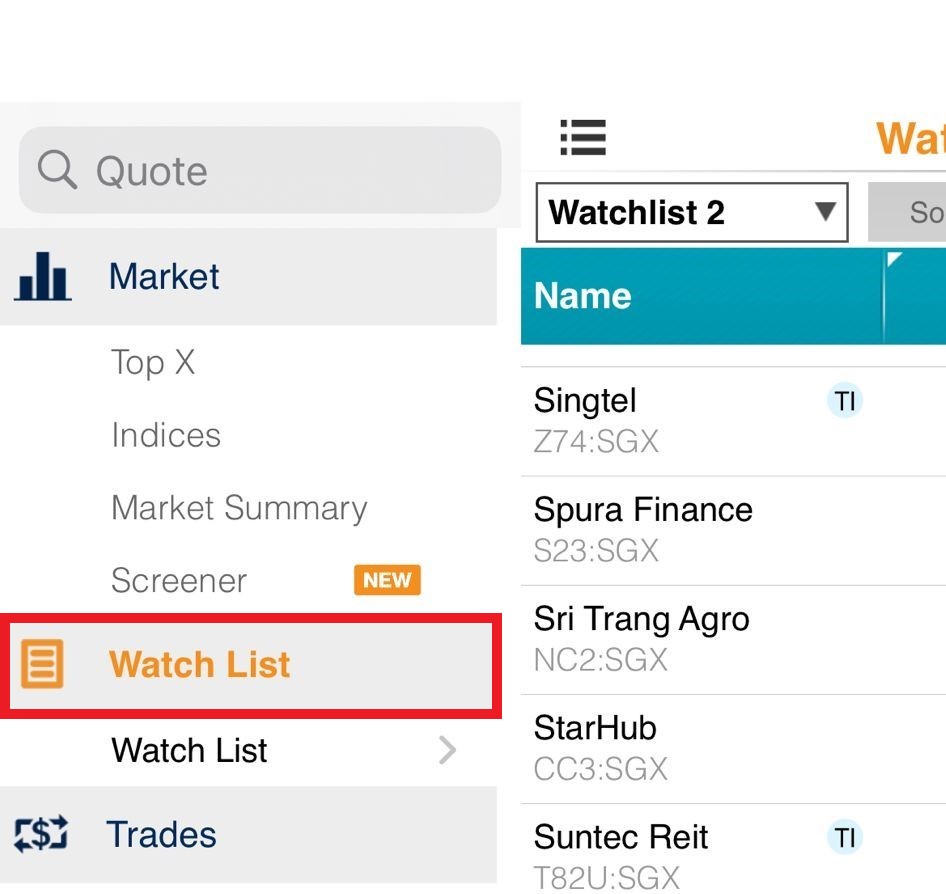
-
08. CAN I USE LTS AI CHARTING IF I HAVE NOT ACTIVATED FOREIGN MARKET LIVE PRICES?
Yes. You will still be able to utilise LTS AI Charting on a delayed basis.
-
09. WHERE CAN I LEARN MORE ABOUT THE VARIOUS TECHNICAL INDICATORS?
To learn more about the various technical indicators, you may refer to this User Guide for the LTS AI Charting Web version or the following User Guide for the Mobile version.
-
10. WHAT ARE THE MARKET DATA FILTERS?
The introduction of Market Data Filters aims to enhance the screener experience, allowing clients to further refine the screener results based on specific market data criteria. You may refer to the table below to learn more about the data filter options:
Filter
Description
Previous Close
Previous trading day closing price
Previous Volume
Previous trading day traded volume
^Market Value
Issued Shares * Previous Close
^PE Ratio (TTM)
Previous Close / Earning per Share
where,
Earning per Share is Net Profit (TTM) / Issued Shares^Dividend Yield
Retrieved from latest annual report
^Revenue
Retrieved from latest annual report
^Revenue Growth Rate
( (Latest Annual Revenue - Previous Annual Revenue) / Previous Annual Revenue) * 100%
^Net Profit Growth Rate
( (Latest Annual Net Profit- Previous Annual Net Profit) / Previous Annual Net Profit) * 100%
^Available for SGX and Bursa market only.
-
11. WHAT IS THE BACK-TESTING FUCTION?
The Back-testing Function is an additional service that sets us apart from the rest, providing a unique opportunity for clients to explore the potential success of their trading tactics.
Currently available on our web-based platform, you may select "Mkt Prices" followed by "TA Assistant Screener" to find out more. Alternatively, you may refer to the Web User Guide HERE.
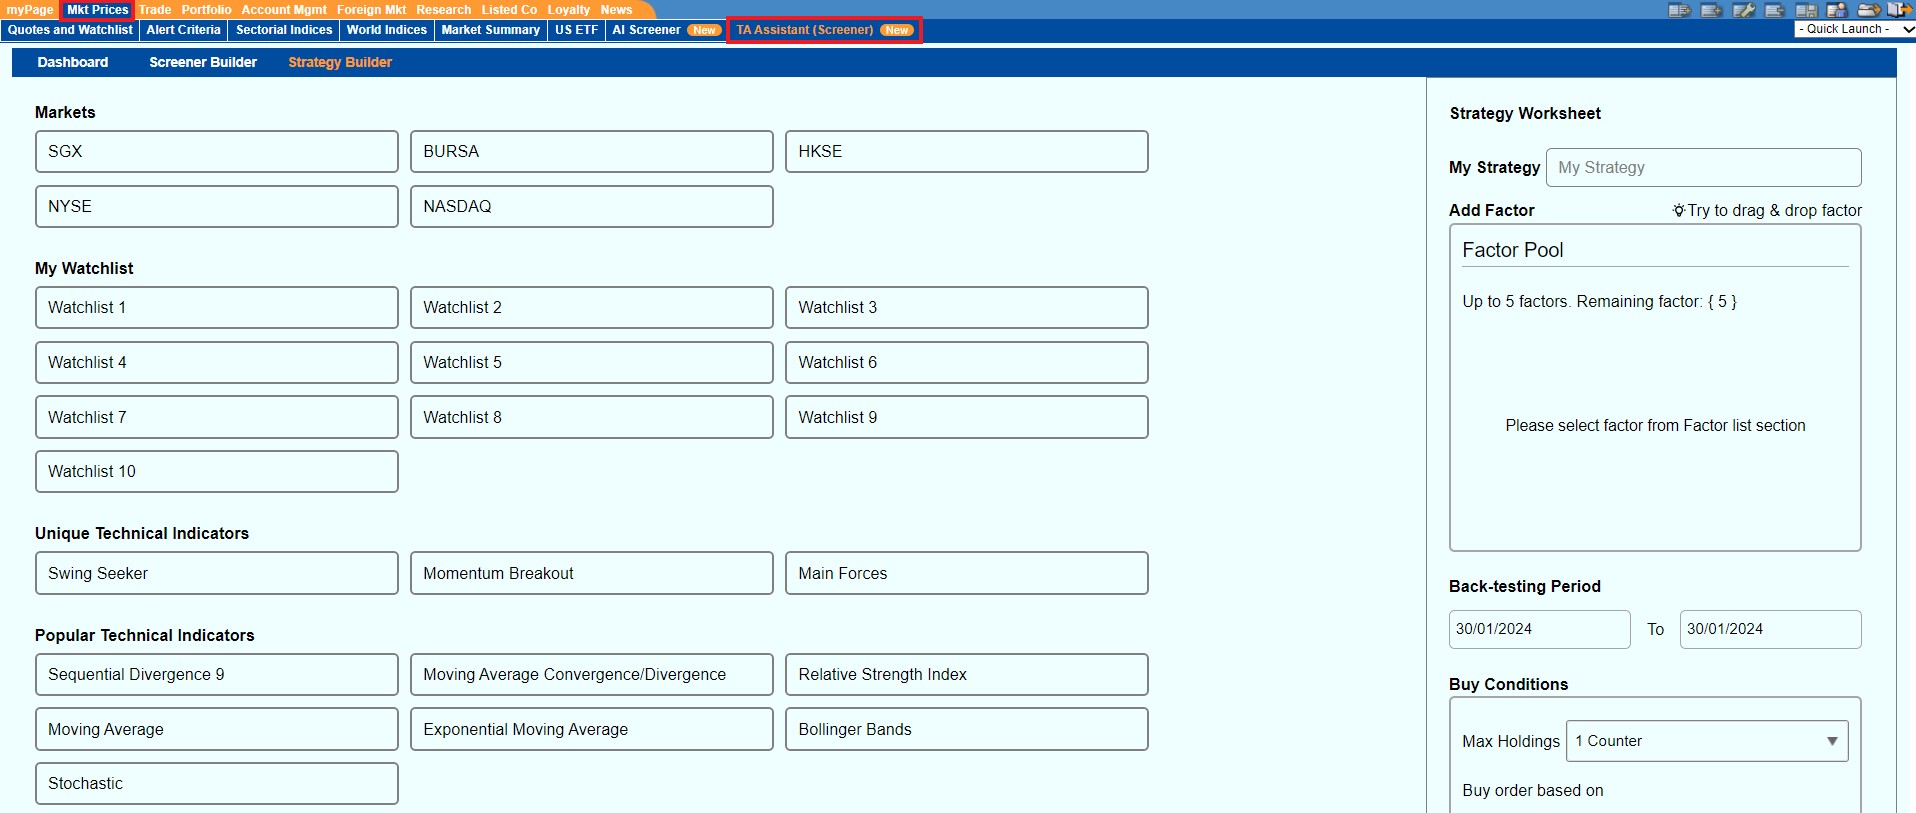
- Supports SGX, Bursa, HKSE, NYSE and Nasdaq markets.
-
12. HOW DO I LAUNCH THE LTS AI CHARTING?
More information is available in this User Guide for the LTS AI Charting Web version. You may also refer to the User Guide for the Mobile version.
-
13. WILL I STILL QUALIFY FOR THE US & HK ATP WHEN I TRADE VIA THE LTS AI CHART FOR US & HK INTRA-DAY CONTRA TRADES?
For the US & HK Intra-Day Contra Trades done via the LTS AI Chart, you will not be eligible for both US & HK Intra-Day Active Trader Programs (ATP). However, you will be able to enjoy the low brokerage rates of 0.07% for US Contra Intra-day AI Charting and 0.12% for HK Contra Intra-day AI Charting respectively with just 1 Online intra-day contra trade. You may click HERE for more information.
This advertisement has not been reviewed by the Monetary Authority of Singapore.